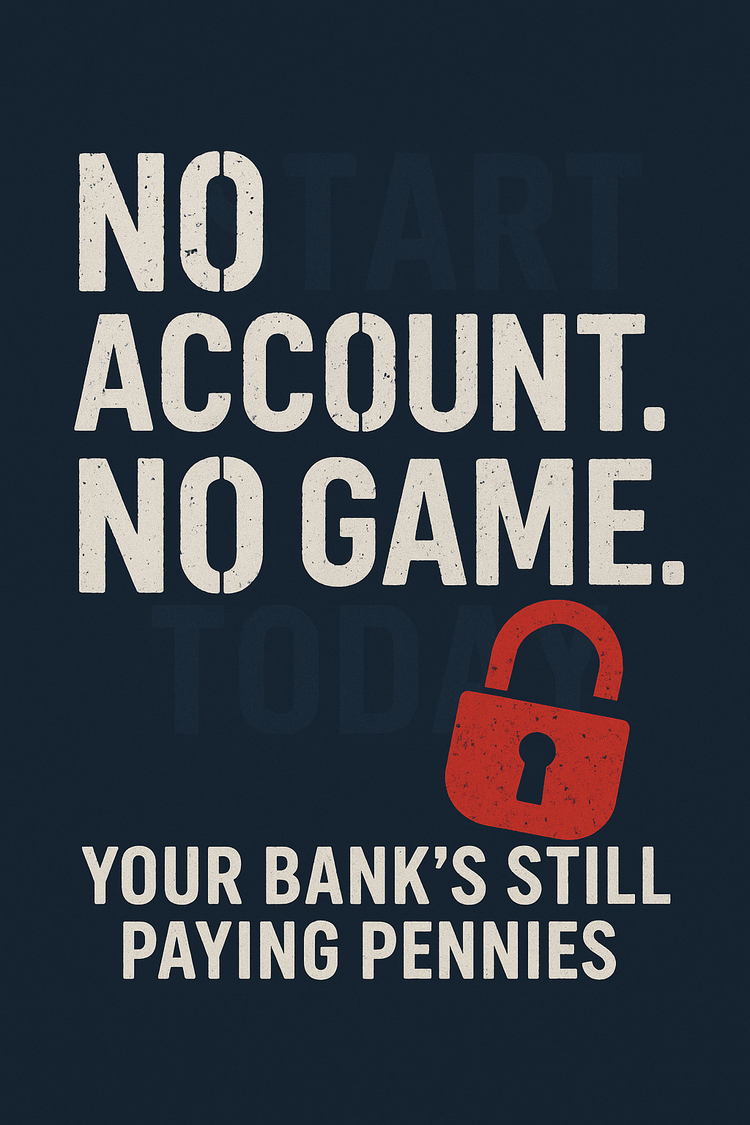
What Is a Brokerage Account? Your Ticket to the Money Party
Without a brokerage account, you’re not an investor — you’re a spectator. Here’s why it matters, how it works, and how to use it to actually build wealth.
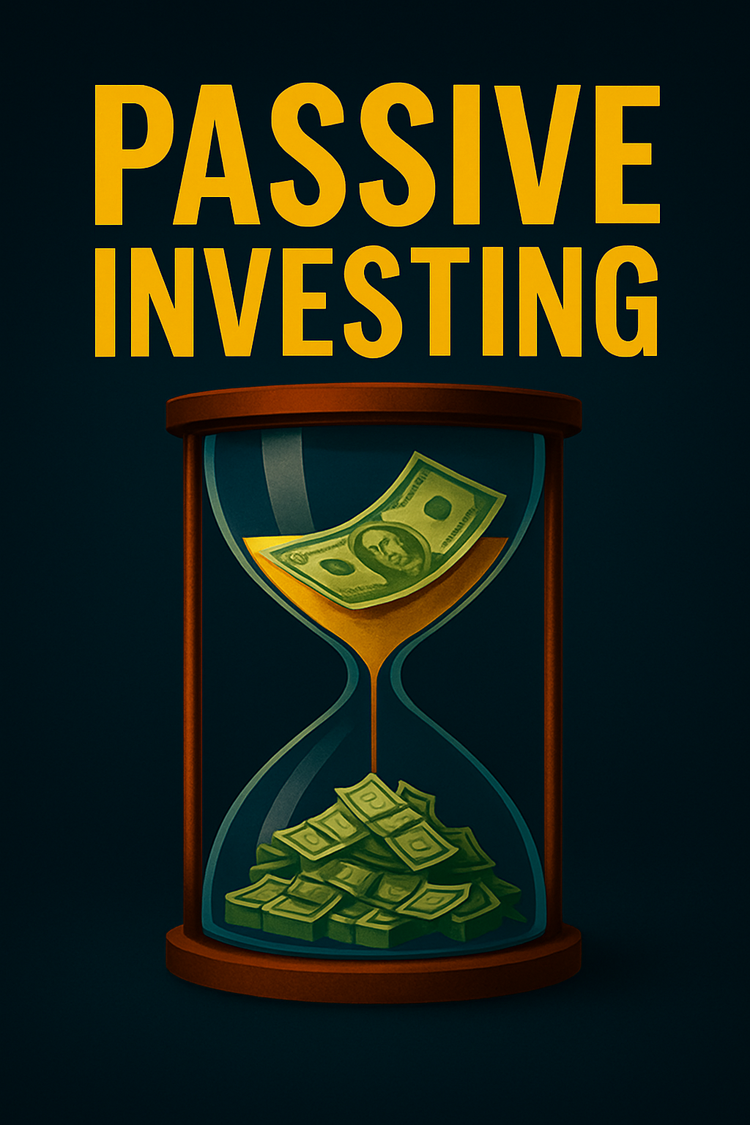
What is Passive Investing?
Passive investing is boring on purpose — and that’s why it works. Here’s how it builds wealth, why it beats most pros, and why you might need it.
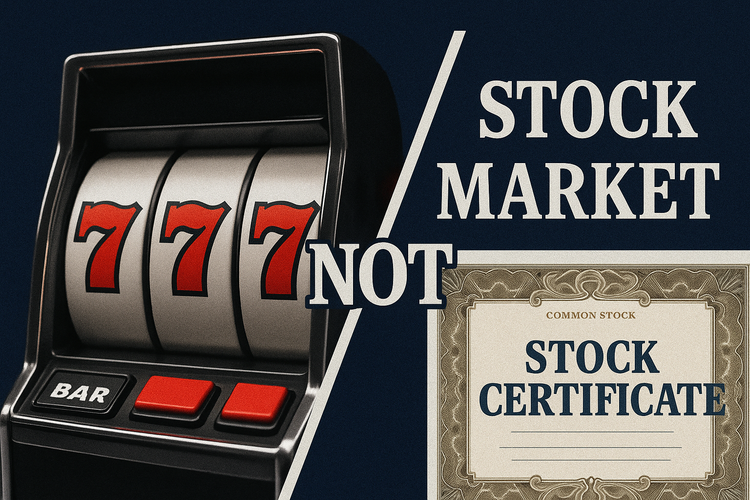
How Does the Stock Market Work?
The stock market isn’t a casino — it’s an auction. Prices move because of business results, mood, and the big picture. Respect it with a process and it works. Treat it like gambling and it’ll clean you out.
What I Learned About Risk While Building My First Investment Portfolio
“I built my first portfolio back in 1990 — and learned the hard way what happens when the market turns. Three simple questions turned that shaky start into a plan I can trust through any market. Here’s how you can do the same.”
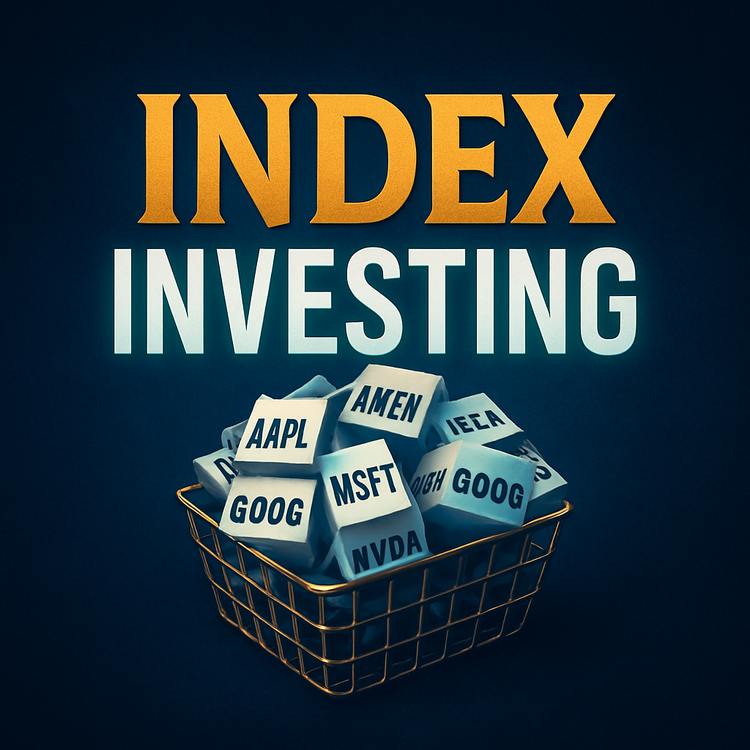
What is Index Investing?
Index investing sounds simple: just buy the market. But once you look under the hood, you’ll see it’s not as bulletproof as the guides make it sound.
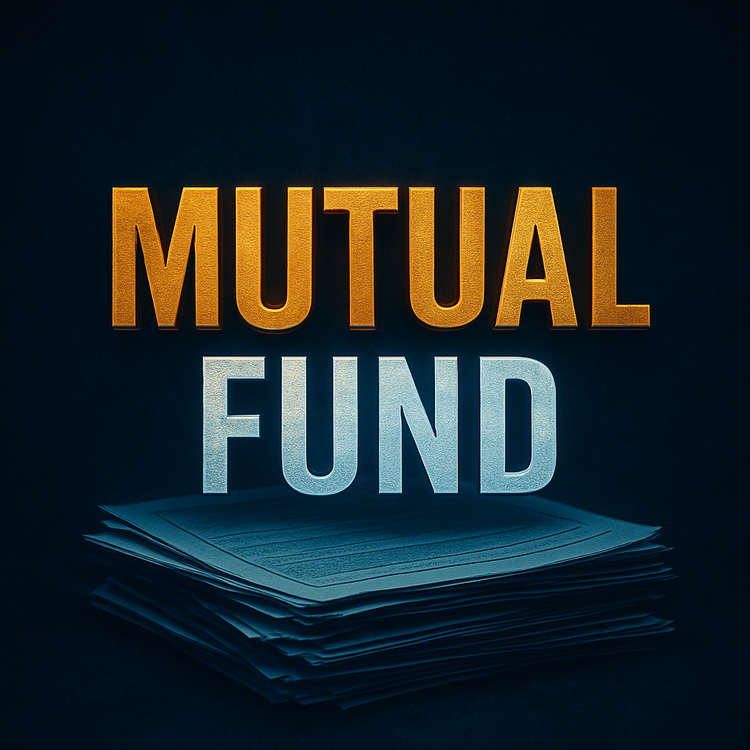
What is a Mutual Fund?
Mutual funds are the old-school way to invest. Before ETFs came along, this was the default. If you had a
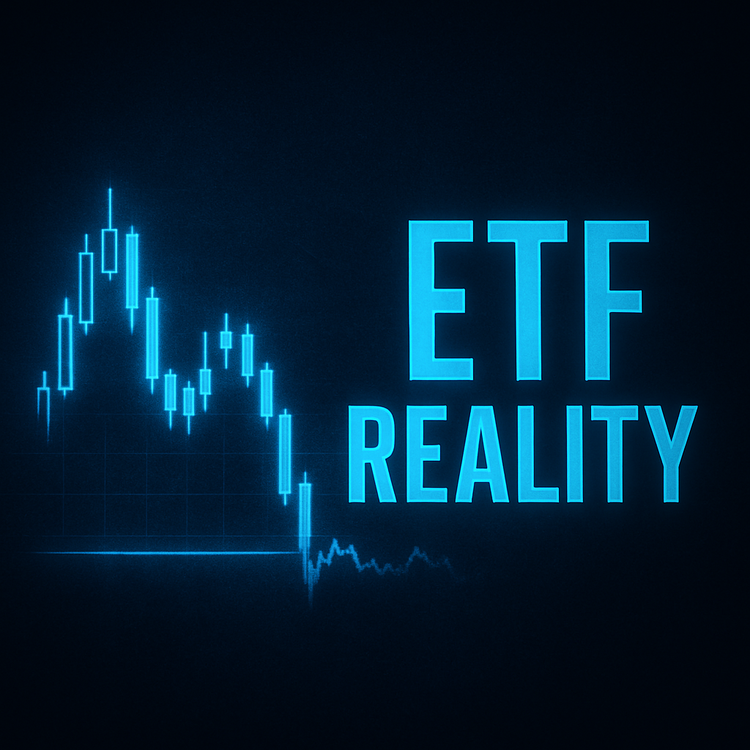
How to Start Investing in Stocks — The ETF Reality Check
Beginner investing rules look simple on paper. But when you run them through real ETFs and real markets, the story changes fast
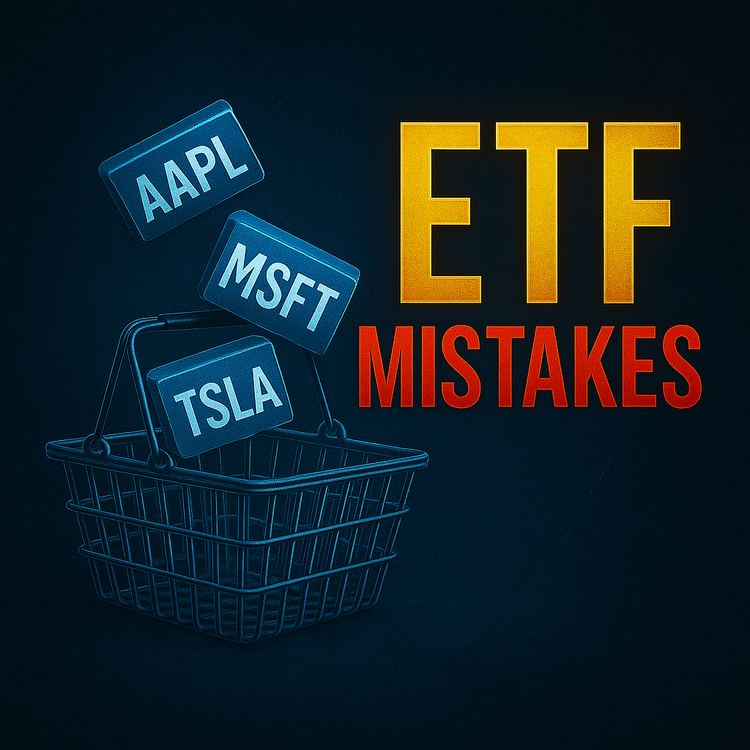
What is an ETF?
Most people buy ETFs without knowing what’s inside. That mistake can cost you. Here’s the no-BS guide to how ETFs really work.
How To Choose a Financial Advisor
Most advisors sound smart, but many just sell products. Here’s how to spot the real ones before they drain your wallet.
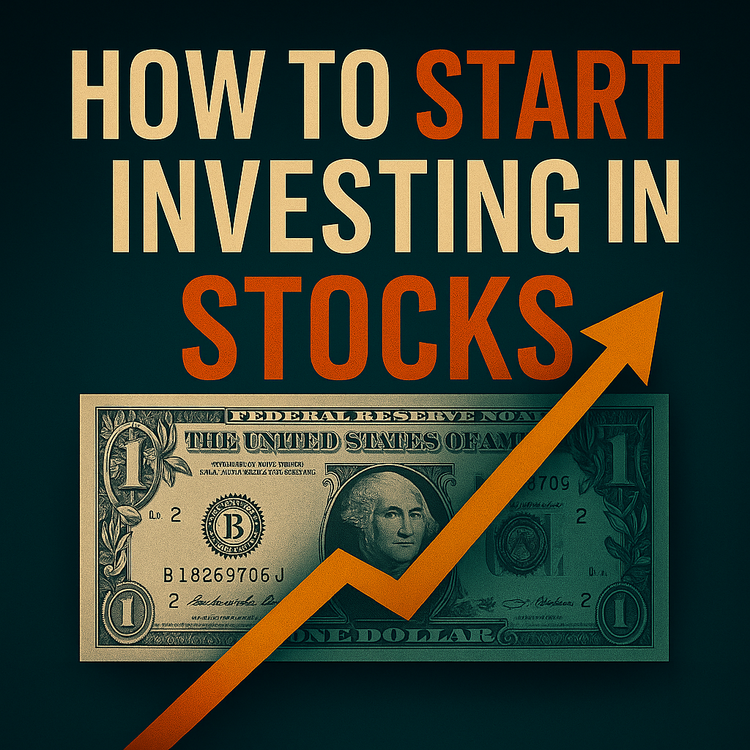
How to Start Investing in Stocks?
You don’t need to be an expert to start investing in stocks. Begin small, research what you know, reinvest dividends, and let compounding do the work.