Market Cap: Fast Guide for New Investors
Market cap frames the bet. Cash flow funds it.
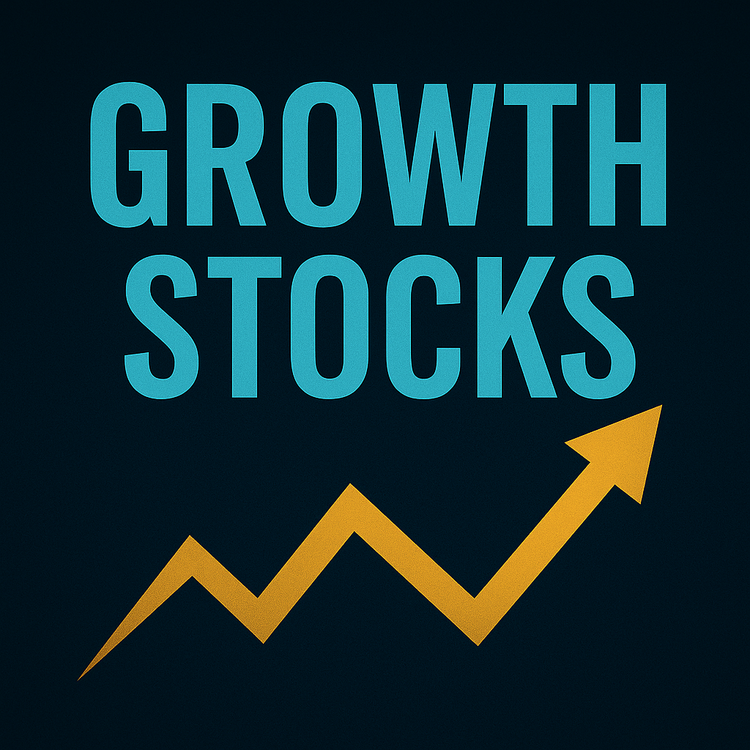
Understanding the Risks and Rewards of Growth Stocks for DIY Investors
Growth stocks create millionaires and wipe them out just as fast. The difference isn't luck- it's discipline. Learn how to spot real growth, avoid hype, and survive the volatility that kills most DIY investors before they ever see the payoff.
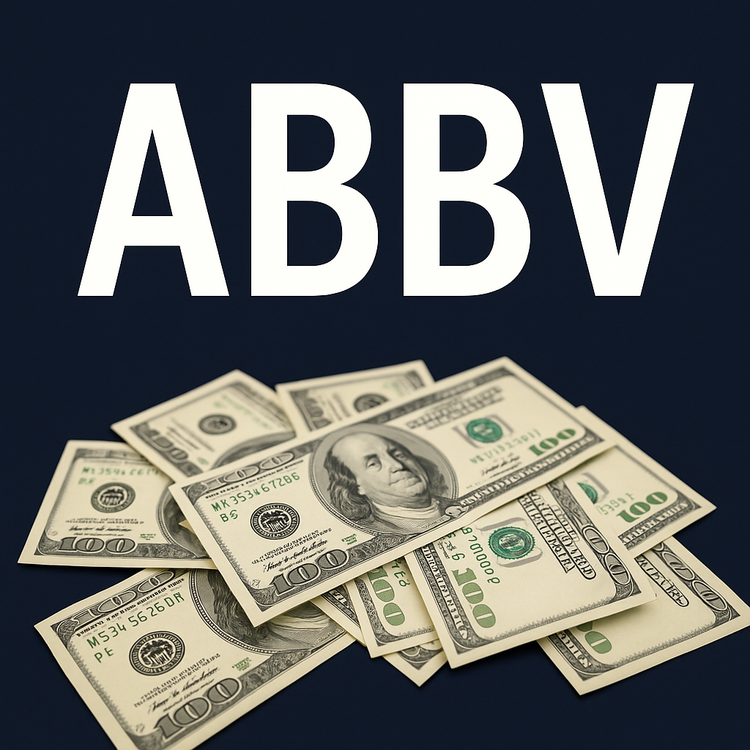
AbbVie: Boring Business, Beautiful Cash Flow
AbbVie survived the Humira patent cliff everyone feared. Now at single-digit P/E with $22B in free cash flow and a 3% yield, you're paying for pharma discipline while others chase biotech moonshots. Sometimes boring wins.
Math Over Hype: Why Most Investors Are Doing This Wrong
Stop chasing narratives. Start reading balance sheets.
How to Create a Buy-and-Hold Strategy That Actually Fits Your Goals
Buy-and-hold isn’t “buy and forget.” It’s a discipline tied to your goals—quality companies, sustainable dividends, and total return that compounds quietly over time.
Chevron: Built for Cash, Not Clicks
Chevron survived the Hess deal distraction. Now at $153 with 80% upstream margins and FCF covering dividends 1.7x, you're paying for discipline at 16.5× earnings. Guyana's $35 breakevens change everything. Target: $170 by 2027.
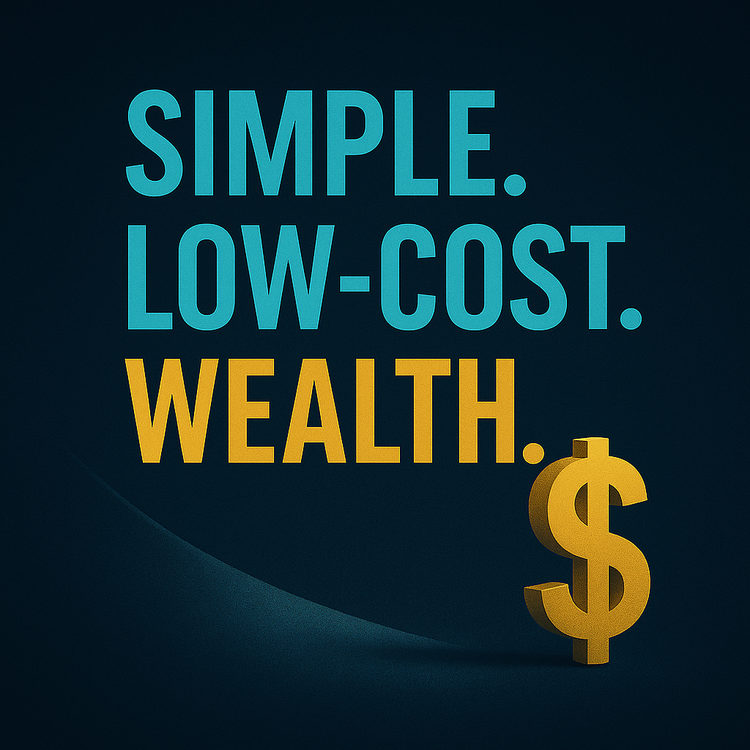
The Smart Way to Start Investing: Low-Cost Index Funds
Most investors overthink the market. Low-cost index funds strip away the noise—minimal fees, instant diversification, and steady compounding. Keep it simple, stay disciplined, and let time do the work.
5 Dividend Kings That Beat ESG Funds at Sustainable Investing
Dividend Kings have raised payouts for 50+ years straight through recessions, rate hikes, and market crashes. Here are five that deliver sustainable income with payout ratios under 70% and cash flow you can count on.
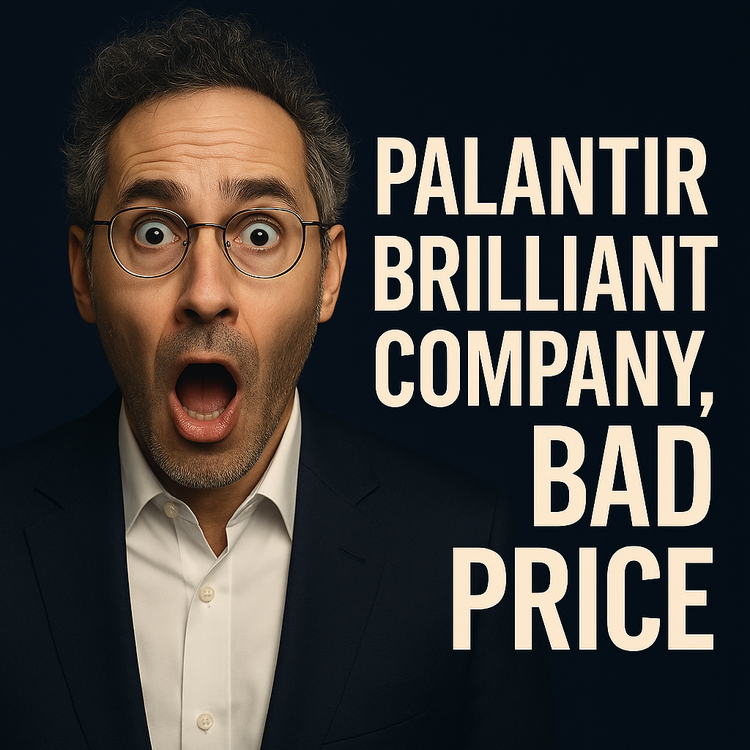
Palantir: The Cult Stock That Forgot It’s Not a Religion
The fundamentals scream brilliance. The price screams mania.
How to Manage Your Portfolio Actively Without Losing Your Mind
Active investing isn’t about staring at charts all day.
It’s about staying alert without losing your sanity.