Bitcoin Part 2: The One Number That's Called Every Top and Bottom

In Part 1, I walked through the Fidelity framework for valuing Bitcoin. This week, we go deeper.
My son wasn’t impressed.
I’d just walked him through the Fidelity math - the gold comparison, the market share scenarios, all of it. He listened. Then he waited.
“So you finally think it could be worth something.”
“Maybe.”
“But you’re still not buying.”
He knows me too well.
I don’t buy things because they could go up. I’ve watched too many people buy “cheap relative to potential” and hold through 80% drawdowns for three years. That’s not investing. That’s hope with a spreadsheet.
“I need to know where we are in the cycle,” I told him. “Are we early? Late? Am I about to catch a falling knife?”
He pulled out his phone. “Mom.
Bitcoin has better data than any stock you’ve ever analyzed.”
The Thing I Didn’t Know
Here’s what nobody told me:
Every Bitcoin transaction for the past 16 years is recorded on a public blockchain. Every. Single. One. We know exactly when each coin moved and at what price.
You know what that means?
Analysts can calculate the aggregate cost basis of every holder in the market. In real time. For free.
Imagine knowing the average purchase price of every Apple shareholder. Impossible, right? For Bitcoin, it’s just... there.
“Okay,” I said. “Show me.”
MVRV
He showed me a metric called MVRV. Market Value to Realized Value.
I braced for complexity. It wasn’t.
Market Value = what Bitcoin is worth today. Price times supply. Same as stocks.
Realized Value = what everyone actually paid for their coins. The aggregate cost basis.
That’s it. You’re comparing what the market says it’s worth versus what people are actually in for.
When MVRV is high, everyone’s sitting on huge gains. Greed takes over. Tops happen.
When MVRV is low, everyone’s underwater. Panic. Capitulation. “Bitcoin is dead.” Bottoms happen.
“Sounds too simple,” I said.
“Look at the chart.”
He turned his phone around. I went quiet for a long time.
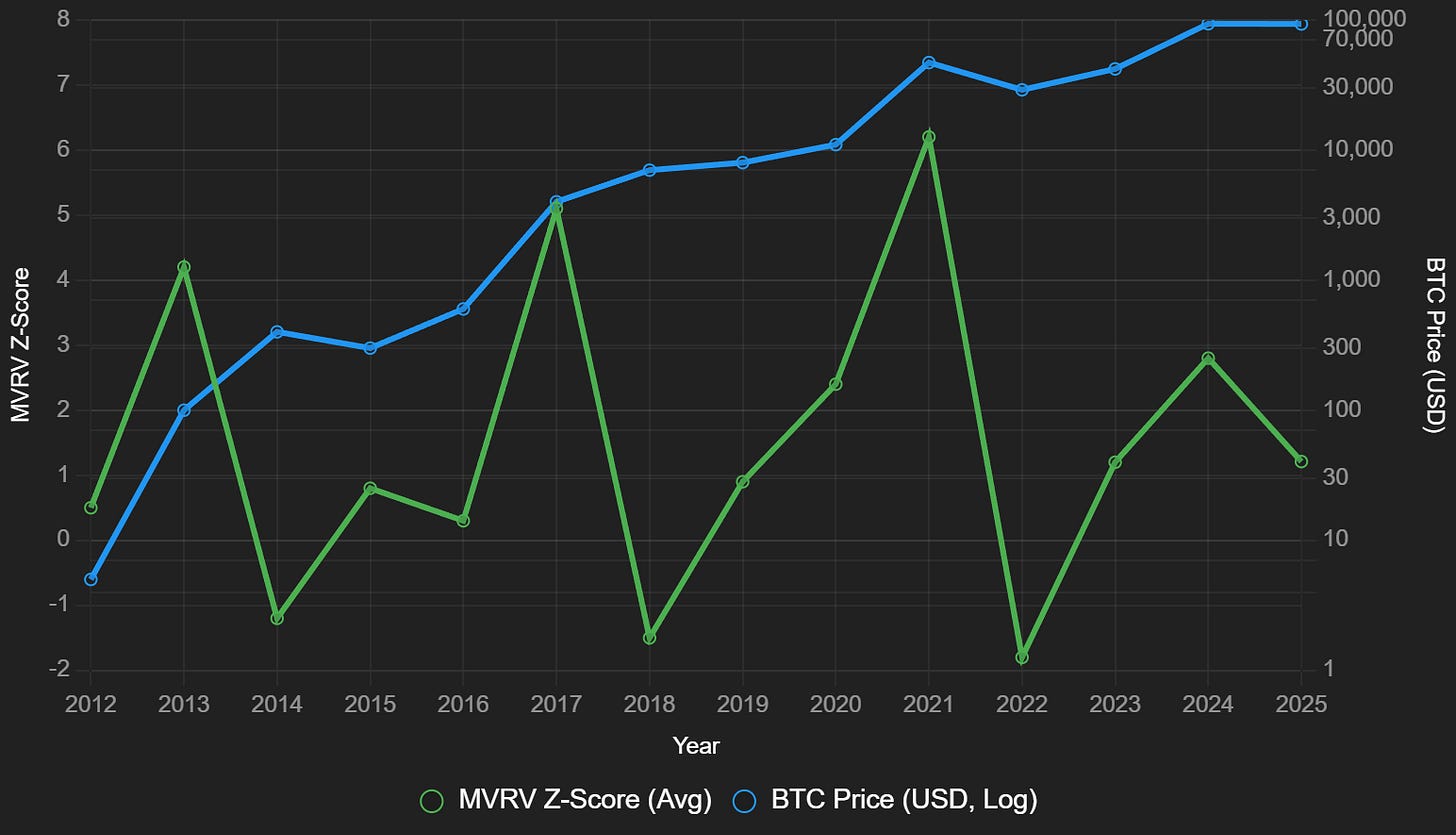
Chart: Grok (xAI) – data via Glassnode
Green line spikes = tops. Green line below zero = bottoms. Blue line is price. Thirteen years.
Six spikes. Six crashes. Six bottoms. Six recoveries.
The pattern isn’t subtle.
“Why doesn’t everyone know about this?”
He shrugged. “Because it’s not exciting. It just works.”
Where Are We Now?
I looked at the right edge of the chart. December 2025.
“So where’s the danger zone?”
“Above 4, getting greedy. Above 7.5, you’re the last one to the party. Below zero, everyone’s given up - that’s when you buy.”
“And right now?”
“1.2. Neutral. Not cheap, not crazy. Mid-cycle.”
Bitcoin sitting at $93,000 with an MVRV of 1.2 means we’re not in euphoria. But we’re not at a screaming buy either. The cycle is moving, but it hasn’t overheated.
The Holes
I poke at everything. It’s what I do.
“What’s wrong with it?”
My son rolled his eyes. “Mom...”
“Seriously. What am I missing?”
Three things:
ETFs are invisible. Coins sitting in BlackRock’s fund don’t move on-chain. As institutions pile in, some data goes dark.
The spikes are shrinking. 2013 hit 8. 2017 hit 5. 2021 only hit 6. Either the market’s maturing or the signal’s weakening.
It tells you where, not when. MVRV can stay elevated for months before the crash. It’s a positioning tool, not a timing tool.
Good. Honest limitations. I can work with that.
But something was still missing.
The Piece He Couldn’t Give Me
MVRV tells me where we are in Bitcoin’s internal cycle. That’s valuable. More than I expected.
But Bitcoin doesn’t exist in a vacuum.
When the Fed prints, risk assets rise. When they tighten, everything falls. Bitcoin trades like a high-beta tech stock whether the true believers admit it or not.
I asked my son about macro. Interest rates. Liquidity. Dollar strength.
He got quiet.
“That’s your world, Mom. Not mine.”
For the first time in fifteen years, I wasn’t sure he was wrong.
Part 3: The Macro Lens
There’s an analyst named Lyn Alden who built a framework connecting Bitcoin to global liquidity. The Fed might matter more than the halving.
Right now, MVRV says mid-cycle. Neutral. No panic, no euphoria.
But the liquidity picture is saying something different.
Part 3: which one’s lying.
Subscribe so you don’t miss it.
This is for informational purposes only and should not be considered investment advice. I am not a financial advisor. Always do your own research before making any investment decisions.


Member discussion