When Dividends Eat Their Own Seed Corn
Free cash flow has two mouths to feed: you and the future. Overpay one, starve the other, and something breaks. Usually your safe income breaks first.
The Claim
Everyone obsesses over payout ratios and yield. Wrong line.
The dividend doesn’t come out of EPS. It comes out of free cash flow after the business has fed itself.
Here’s the reality that dividend-chasers need to internalize: free cash flow has three non-negotiable buckets:
- Maintenance capex — keeping the lights on, replacing worn-out equipment, maintaining competitive position
- Growth capex — expanding capacity, entering new markets, building tomorrow’s revenue streams
- Distributions — dividends and buybacks, the cash that actually reaches shareholders
If bucket three starves bucket two, the “income” is just liquidation in slow motion. You’re not earning yield — you’re consuming the company’s future.
The Case File: Two Companies, Same Cash, Different Fate
Let’s make this concrete with two hypothetical companies. Same starting point, radically different capital allocation philosophies.
Both companies generate $10 billion in operating cash flow. Both need $4 billion for maintenance capex — that’s non-discretionary, just keeping the business running. That leaves $6 billion of Owner’s FCF to allocate between growth and distributions.
Here’s where they diverge:
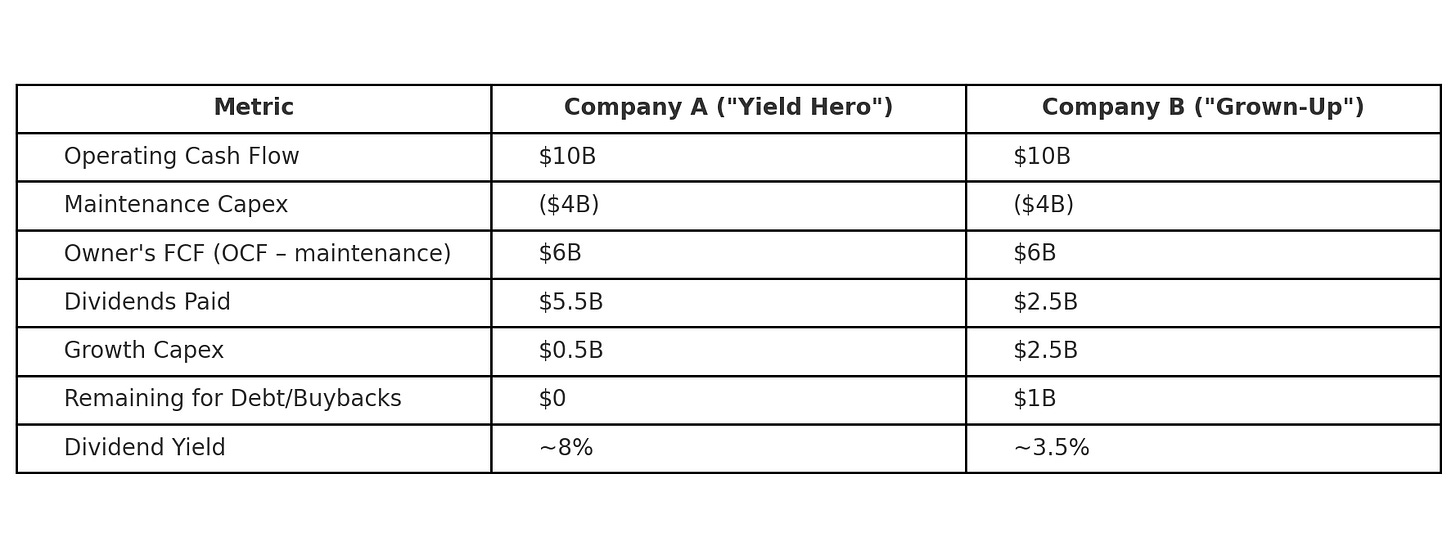
Company A is sending roughly 92 cents of every Owner’s FCF dollar out the door. Company B is sending a bit over 40 cents and reinvesting the rest.
What Happens Over Ten Years
Company A looks fantastic on a dividend screener. Eight percent yield. Decades-long payout streak.
But with only $500 million going to growth, revenue flatlines. Maybe it creeps up 1–2% annually from price increases, but there’s no real capacity expansion, no meaningful market share gains. The business is treading water — and hoping the tide never goes out.
Then a recession hits.
Revenue drops 15%. Operating cash flow falls to $8.5 billion. Maintenance capex is non-negotiable — that $4 billion stays. Suddenly the company faces an impossible choice:
- Slash the dividend (destroying the “income” thesis),
- Cut maintenance capex (accelerating decline), or
- Take on debt to fund the payout (borrowing from the future).
Company B looks boring by comparison. A 3.5% yield won’t win any screener popularity contests. But that $2.5 billion in annual growth capex compounds. Revenue grows 5–7% annually. Operating cash flow expands.
Ten years later, even at the same yield percentage, the absolute dividend is substantially larger — and the company has the financial flexibility to maintain it through downturns.
Same starting FCF. Completely different outcomes. The difference is entirely in how that cash was allocated.
Sound Familiar? AT&T, Walgreens, 3M
For years, AT&T paid you a 7%-plus yield and called it “income.”
In 2022, the math finally snapped: the quarterly dividend was chopped from $0.52 to $0.28 — a near-half cut that vaporized a 35-year streak overnight. The label (“Dividend Aristocrat”) didn’t protect anyone. The cash flows didn’t support the promise.
Instead of aggressively fortifying its network, AT&T spent a decade chasing trophies — DirecTV, Time Warner — funded with a debt pile north of $150 billion. The dividend was the sugar coating that kept people from looking too closely at the balance sheet.
Today, AT&T’s revenue growth barely clears inflation in a good year — and that’s before you factor in the $20 billion-plus it has to pour into capex just to stay in the 5G race. If FCF dips in a slowdown, that “safe” mid-single-digit yield is right back on the chopping block.
The income investors who bought AT&T for that fat 7% yield watched their payout get cut in half — and the stock price collapse. They got the worst of both worlds: less income and less capital.
If the dividend is eating tomorrow’s cash, it isn’t income. It’s liquidation on a delay.
And it keeps happening.
In January 2024, Walgreens cut its dividend by 48% after a 47-year streak of increases. The FCF numbers were almost comical: in the twelve months ending August 2024, Walgreens paid $1.26 billion in dividends while generating just $23 million in free cash flow.
That’s roughly fifty dollars paid out for every one dollar truly earned. Nobody should be shocked the dividend snapped.
And by early 2025, Walgreens didn’t just cut the dividend — it suspended it outright after more than 90 years of payouts.
3M followed suit in April 2024, slashing its payout by 54% after spinning off its healthcare business — ending 64 years of consecutive increases.
A 64-year streak didn’t matter. The cash did.
Where Investors Get Killed
The failure isn’t bad luck. It’s bad focus.
Most dividend investors obsess over:
- Yield
- EPS payout ratio
- Streak length
What almost nobody graphs out:
- FCF after maintenance capex
- Growth capex needs
- Leverage and hidden obligations
If all the free cash flow is going to you, none of it is going back into the machine. At some point the machine stops growing. And when growth stops, the market won’t keep paying a “safe” multiple for your coupon.
You end up with bond-like returns and equity-like drawdowns — the worst trade in the market.
AT&T looked like an income star right up until the first real reckoning. Walgreens was a Dividend Aristocrat until it wasn’t. 3M was a Dividend King for 64 years — until the FCF math made that title meaningless.
The Rules I Actually Use
Here’s my framework for evaluating dividend sustainability. Feel free to steal it.
Step 1: Calculate Owner’s FCF
Operating cash flow minus real maintenance capex. That’s the pot you’re actually slicing up. Everything else is story.
Step 2: Budget the Cash Before You Look at Management’s Spin
On paper, decide what a sane split between growth capex and distributions should look like for this business. Then see how far reality deviates.
Step 3: Apply Comfort Ranges
- Around 60–70% of Owner’s FCF or less = Compounder territory.
Dividend growing with the business, room to de-lever. This is where long-term income investors actually want to live. - 70–90% = Income bond.
Size it like a bond with equity volatility. Expect lower growth, be prepared for volatility in a downturn. - >90% or funded with debt = Yield trap.
You’re not getting income; you’re getting your principal dripped back to you.
These filters would have flagged AT&T years before the cut. They would have caught Walgreens when FCF was collapsing while the dividend kept climbing. They would have signaled 3M’s vulnerability when legal liabilities started eating into the cash cushion.
Portfolio Consequences
So what does this framework change in practice?
- High yield with no room for growth and no deleveraging
= bond proxy with equity risk. Small position, if at all. The yield looks attractive right up until it isn’t. - Lower yield with strong FCF coverage and real reinvestment
= an actual long-term income engine. The dividend grows because the business grows. Compound that for a decade.
When I screen dividend stocks or evaluate a pitch, I don’t care what the yield is until I see the FCF waterfall.
Show me the flow: Operating cash flow → maintenance capex → growth capex → dividends and buybacks → debt. Then we can talk about whether that yield is real or borrowed from the future.
If free cash flow can’t comfortably fund both your paycheck and tomorrow’s growth, that payout isn’t “generous” — it’s theft from your compounding.
The fix isn’t prediction. It’s process.

Member discussion