How to Actually Value Bitcoin (When Everyone Else Is Guessing)
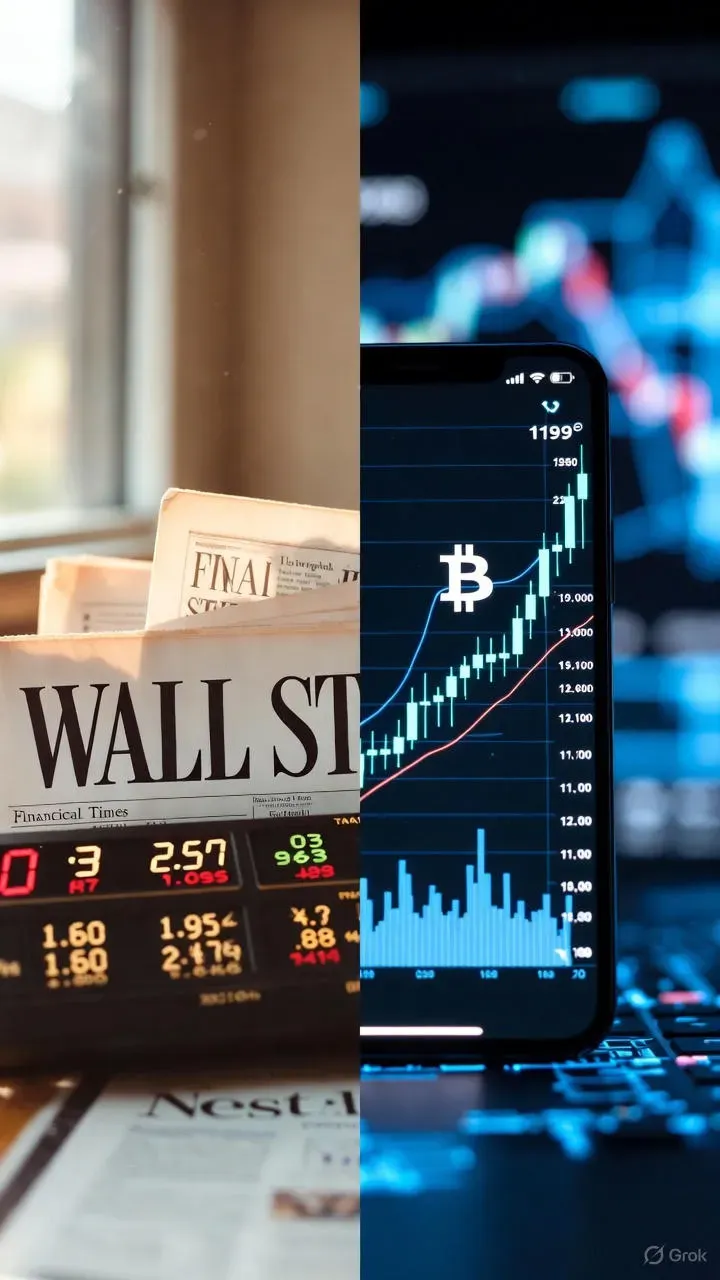
My son and I argue about Bitcoin. Constantly.
He sends me charts. I send him cash flow statements. He talks about digital scarcity. I talk about tulip bulbs. He’s patient with me the way you’re patient with someone who still prints out emails.
His portfolio is up 300% in five years. Mine is up 60%.
At some point, “I don’t understand it” stops being a reason and starts being an excuse.
The Lazy Dismissal
“It doesn’t generate cash flow” was my get-out-of-jail-free card for fifteen years.
No earnings? Can’t value it. Not my problem. Back to analyzing Coca-Cola.
Then it hit me:
Gold doesn’t generate cash flow either.
Neither does a Picasso.
Neither does a 1952 Mickey Mantle rookie card. Nobody calls them worthless.
My framework wasn’t wrong. It was incomplete.
So I told my son I’d actually do the work. Read the serious research - not Reddit posts or YouTube videos from guys in Lamborghinis. The institutional stuff.
I found it in the last place I expected.
Fidelity. Yes, That Fidelity.
The people managing $4.5 trillion in retirement accounts. Your grandmother’s nest egg.
They have an entire division for digital assets. Their whole thesis fits in one sentence:
Bitcoin is digital gold.
That’s the unlock.
Once I heard it that way, I stopped trying to jam Bitcoin into my DCF spreadsheet. You don’t value gold with discounted cash flows. You value it based on supply and demand.
The analogy isn’t perfect. Gold has industrial uses and 5,000 years of cultural weight. Bitcoin has 15 years and a different value proposition - censorship resistance, borderless transfers, hard-coded scarcity. But “digital gold” is close enough to give us a framework.
And Bitcoin’s supply situation is kind of unfair.
The Cheat Code
There will only ever be 21 million Bitcoin. Not “probably.” Ever. It’s baked into the code like gravity is baked into physics.
Every four years, new supply gets cut in half. The issuance rate is under 1% now - already lower than gold’s ~1.6%. By 2028 it’ll be under 0.5%. By 2032, under 0.25%. Heading toward zero whether anyone likes it or not.
Meanwhile, gold miners dig faster when prices rise. Central banks print money until the printers melt.
Bitcoin can’t do either. Supply is solved. The only variable left is demand.
The S-Curve
Every transformative technology follows the same adoption curve: nobody cares, then everybody cares, then it’s priced in.
Draw it on a graph - it looks like a lazy “S.”
Bitcoin is somewhere on that curve. Most serious analysts think we’re still on the steep part. My son is certain of it.
The Math That Matters
All the gold ever mined is worth about $30 trillion. All Bitcoin? Under $2 trillion.
What if Bitcoin takes some of gold’s job?
10% of gold’s role = ~$150,000 per coin.
25% = ~$375,000.
50% = ~$750,000.
All of it = $1.5 million or more.
Today’s price around $93,000 implies the market thinks Bitcoin eventually captures about 6% of gold’s role.
If you think it’s more? Today looks cheap. If you think it’s less? Expensive.
That’s the entire game. One question: How much of gold’s job does Bitcoin eventually take?
Everything else - the tweets, the drama, the laser eyes - is noise.
I texted my son these numbers. He said “now you’re getting it.”
Not so fast.
So Why Am I Not Buying?
Because Fidelity’s framework has a massive hole in it.
Knowing the destination doesn’t tell me when to leave.
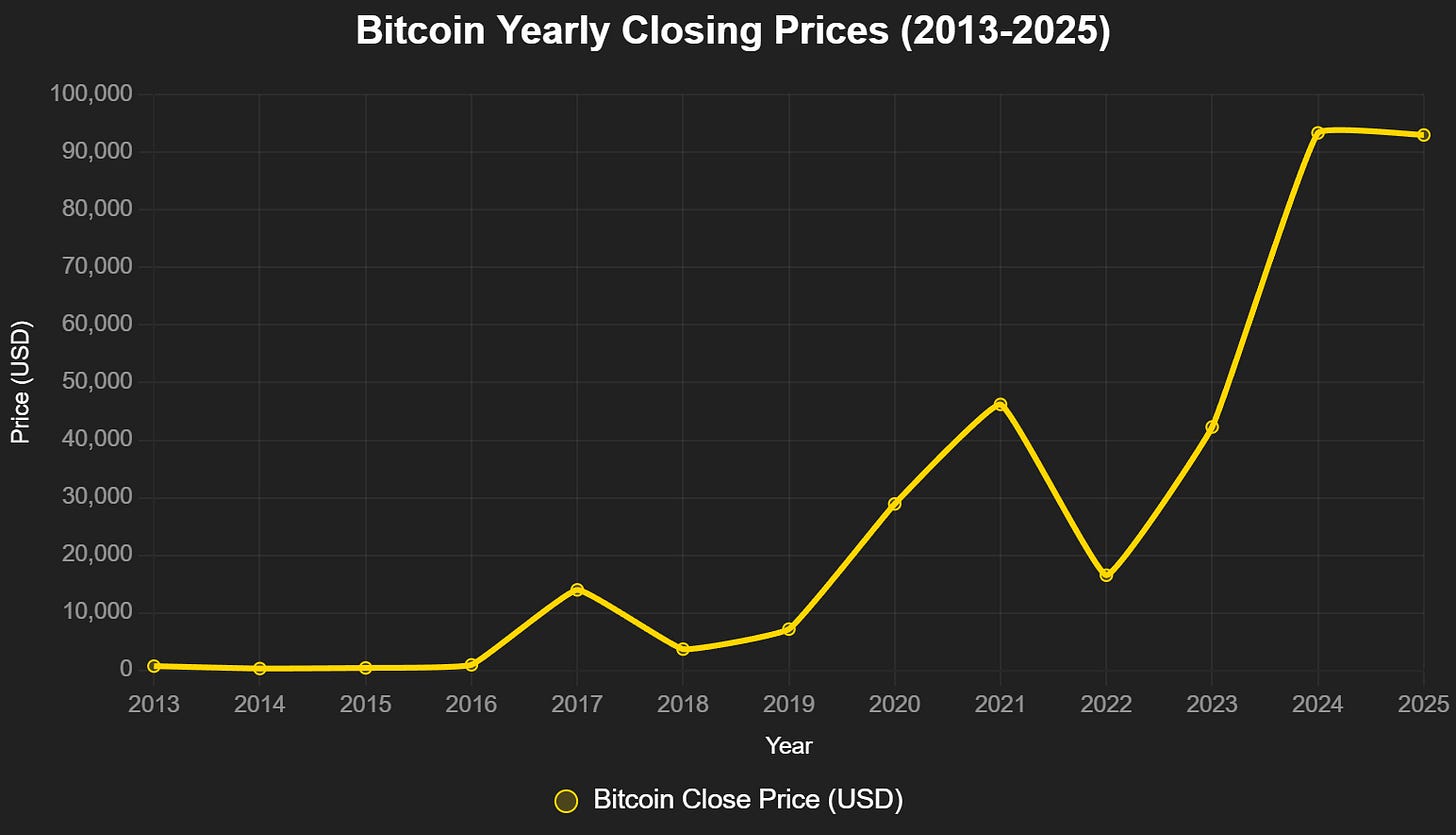
Look at this chart. Every spike, a crash. Every crash, a recovery to higher highs. 2013, 2017, 2021 - same pattern.
Let’s say I’m convinced Bitcoin eventually hits $375,000. Should I buy at $93,000? What about $150,000? What about $200,000 after a 40% run-up?
The TAM math says yes to all of them. They’re all “cheap” versus the destination.
But anyone who’s watched Bitcoin for a cycle knows what happens next. It rips to some insane high, everyone declares a new paradigm, and then it drops 80% while the same people explain why it’s actually fine.
I’ve watched people buy “cheap relative to the destination” and hold through an 80% drawdown for three years. That’s not investing. That’s hope with a spreadsheet.
Fidelity gave me the destination. They didn’t give me:
- A way to know where I am in the cycle
- A way to read the macro environment
Without those, I’m just buying a lottery ticket with better odds.
I told my son I wasn’t done yet.
Part 2: The One Metric That Called Every Top and Bottom
Here’s what I wanted to know: Is there a way to tell if Bitcoin is cheap or expensive right now - not versus some theoretical future, but versus its own history?
Turns out there is. One number. It’s called every major peak and trough for the past decade with eerie accuracy.
In 2017, it screamed “get out” at $19,000. People didn’t listen.
In 2018, it whispered “get in” at $3,200. People were too scared.
In 2021, it screamed again at $69,000. Same story.
In 2022, it whispered at $16,000.
It’s the closest thing Bitcoin has to a P/E ratio.
And right now? It’s saying something interesting.
Part 2 drops next Monday. Subscribe so you don’t miss it.
This is for informational purposes only and should not be considered investment advice. I am not a financial advisor. Always do your own research before making any investment decisions.
Member discussion